Hi community fellows. This note is based on my experience. And I hope it will save you time working on a research paper for the first time. In this note, I will show how I organize files and folders to make a research more systematic.
Date: 4/2/2026
Revision: 4/2/2026
Survey ( or review)
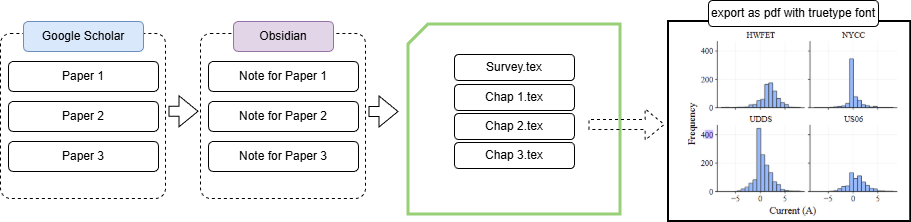
The purpose of a research is to find something new or make an improvement on existing thing. To do so we need to review existing works.
Google Scholar is a good tool to search for relevant papers. Another candidate is ResearchRabbit [2]. Using common Boolean operators such as AND, OR, NOT or quotation mark helps improving the results [1] in Google Scholar.
For Example:
(“autoencoder” OR “Autoencoders” OR “VAE” OR “VAEs”) AND “SOC”
The search query above will find any paper that has either autoencoder, Autoencoders, VAE, or VAEs. At the same time, that paper also need to have “SOC” keyword.
Papers have relevant abstract were saved and organized as below.
Research_writing
+---BDU
+---HIL
+---SOC
|   \---Survey
\---Thermal
After collecting about 20 papers, I read and took note individually. I prefer using Obsidian [3] for note taking because I can build a summary table later. Below is the structure that I used for every paper in Obsidian.
TITLE: A Data-Driven Predictive Prognostic Model for Lithium-ion Batteries based on a Deep Learning Algorithm

---
Algo Type: Deep Neural Network (DNN)
year: 2019
cite#: 300
author: P Khumprom
read: true
link: https://www.mdpi.com/1996-1073/12/4/660
tags:
  - deep-neural-network
  - soh-algo
  - rul-algo
cite:
dataset:
drive-cycle:
temp:
---

#thesis #sox-algo

# Son Note
- STATE OF HEALTH
- This paper does not have physical implementation
- The analysis is based on provided data
Answering meta questions that relate to a research also help grouping the papers or finding a niche direction. The questions can be:
- what algorithm is used
- how does the author setup their experiment
- what are the result
- what metrics are being used?
- what are the areas for improvement (find point that we can improve)
- what are the limitation (find point that we can improve)
After completing all of those task, I will create a new page and add a summarize table there.
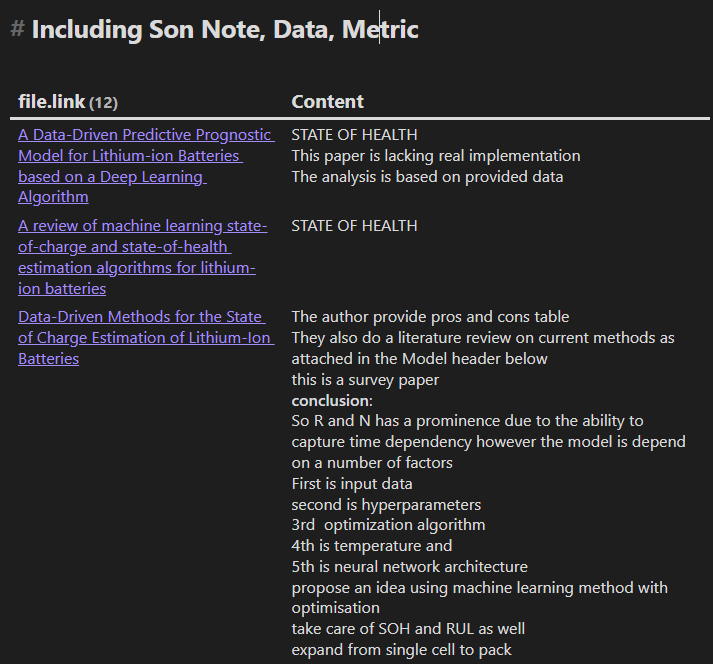
Figure 1: Summarize table
Below is the code to show the table. Dataview plugin may needed to be installed. Fortunately, recent Obsidian version comes with Base feature that performs similar actions with clean GUI instead of writing query.
dataview
TABLE join(rows.item.text, "<br>") AS "Content"
FROM "⭐SOX Algorithm/"
FLATTEN file.lists AS item
WHERE lower(meta(item.section).subpath) = "son note"
   OR lower(meta(item.section).subpath) = "metric"
   OR lower(meta(item.section).subpath) = "data"
   OR contains(item.text, "# Son Note")
   OR contains(item.text, "# Metric")
   OR contains(item.text, "# Data")
WHERE item.text != ""
GROUP BY file.link
In the next steps, we will go over how to manage files and folder so we can organize our research better.
Manage code, script, and results
I used GitHub to manage my code. A good commit note will help a lot in the long run. Additionally, I often add date and time in the results’ filenames to keep track all of result files.
A research may span for one to two years, having a note for each working session will save a ton of time when trying to reproduce the result. Below is an outline of the folder structure.
Research
+---Research_data
|   +---data
|   |   \---original_data (zip them so we can reuse)
|   +---notes (working note for each session)
|   +---results
|   \---scripts
\---Research_writing
    +---BDU
    +---HIL
    +---SOC
    |   \---Survey
    \---Thermal
Notes
Below is an example of working note for each session
# 3-13-2022
Add minmax block in simulink. Need to scale the current to 7A.

# 3-12-2022
...
Results
Plot
To make the figure text searchable, we can export the plot as pdf. Also, a few conference may not allow type 3 fonts, so to be safe, I will use Time New Romans. Below is the snippet to make sure the plot use TrueType or Type 1 instead of Type 3 [4]
plt.rcParams.update({
	"font.family": "Times New Roman",
	"font.size": 14,
	"pdf.fonttype": 42,
})
Then save the figure as pdf
fig.savefig("soc_histogram.pdf", bbox_inches="tight")
Writing
I used Latex on Overleaf [5]. Usually, most university will provide students access to overleaf for free.
I like the clean structure of Latex. For example we can have a main page (main.tex), then inside the main page we can link external file for other chapters.
main.tex:
This is the content of main.tex file.
\section{intro}
\input{chap1.tex}
\input{chap2.tex}
\input{chap3.tex}
The structure of a latex project can be:
fig
	chap1_soc_adaptive.pdf (prefer pdf to make figure clear and searchable)
	chap2_soc_results.pdf
	(i dont want to have many subfolder here because it take time to edit)
main.tex
chap1-review.tex
chap2-advanced-feature.tex
chap3-conclusion.tex
reference.bib
Labeling each figure, table, or equation is important. Below is how I label them
\label{fig:soc}
\label(table:compare)
\label(eq:double)
I may take a break now and update in the future. Let’s gooo and work on something cool! Also, please share if you have ideas to improve the workflow.
Reference
[1] https://library.acg.edu/how-to-guides/google-scholar/advanced-searching
[2] https://www.researchrabbit.ai/
[3] https://obsidian.md/
[4] https://matplotlib.org/stable/users/explain/text/fonts.html
[5] https://www.overleaf.com/